What 4 Days of Real Crypto Trading Bot Results Actually Look Like: A Live Account Case Study
 By Felix Götz
By Felix Götz, Co-Founder and CTO of ArrowTrade AG, building unCoded since 2016 in crypto trading.
Disclosure: I'm Co-Founder and CTO of ArrowTrade AG, the company behind unCoded. This article documents real account results from my own capital over a 4-day window. Past performance and short-term results are not indicative of future results. Crypto trading involves risk, and a 4-day window is too short to draw conclusions about long-term strategy performance. This is not financial advice.
Most articles about trading bot results show curated screenshots from favorable periods. Marketing materials cherry-pick the best week, the best token, the best market conditions, and call it typical.
This article does the opposite. I'm 4 days into a self-experiment running unCoded on my own Binance account with $2,000 starting capital, trading Ethereum and PEPE against FDUSD. The video documentation is on YouTube at youtu.be/A2c1kLAjLac for users who want to verify the dashboard footage directly.
Here's what actually happened, what the numbers mean when you extrapolate carefully, and what 4 days of live bot trading reveals about realistic expectations for retail traders in 2026.
The setup
Starting capital: $2,000
Exchange: Binance Spot
Trading pairs: ETHFDUSD and PEPEFDUSD (paired against First Digital USD, not USDT)
Bot platform: unCoded, self-hosted on my own VPS
Strategy modes: Mode 4 on Ethereum with approximately $60 per buy, more aggressive configuration on PEPE
Time window: 4 days (May 22 evening to May 26 afternoon, 2026)
The choice of FDUSD as the quote currency matters and I'll explain why shortly. It's not a cosmetic detail. It's actually one of the most important variables for any retail trader running high-frequency bot strategies on Binance right now.
Two assets with very different characteristics. Ethereum is a large-cap with established liquidity and slower price movement. PEPE is a meme coin with high volatility, smaller market depth, and far more intraday price action. Running the same bot framework across both produces useful comparison data.
The actual numbers after 4 days
The dashboard shows the results without spin. Here's the current state as of dashboard reading shortly after the video recording:
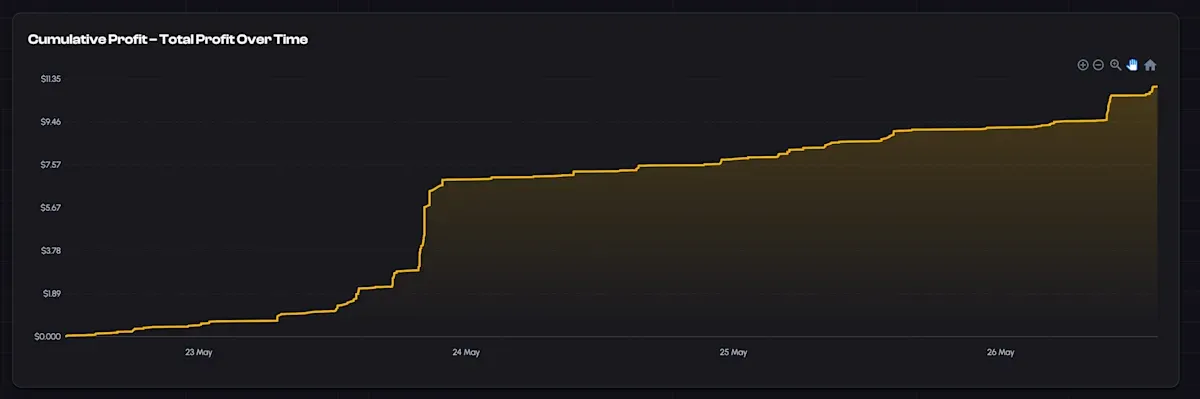
Total Profit: $11.02 gross
Total Sells (completed): 370
Active Orders (pending): 281
Avg BuyPrice: Currently no active position averages displayed (positions are being managed actively)
Total Fees paid to Binance: $0.00 (this is not a display bug, see next section)
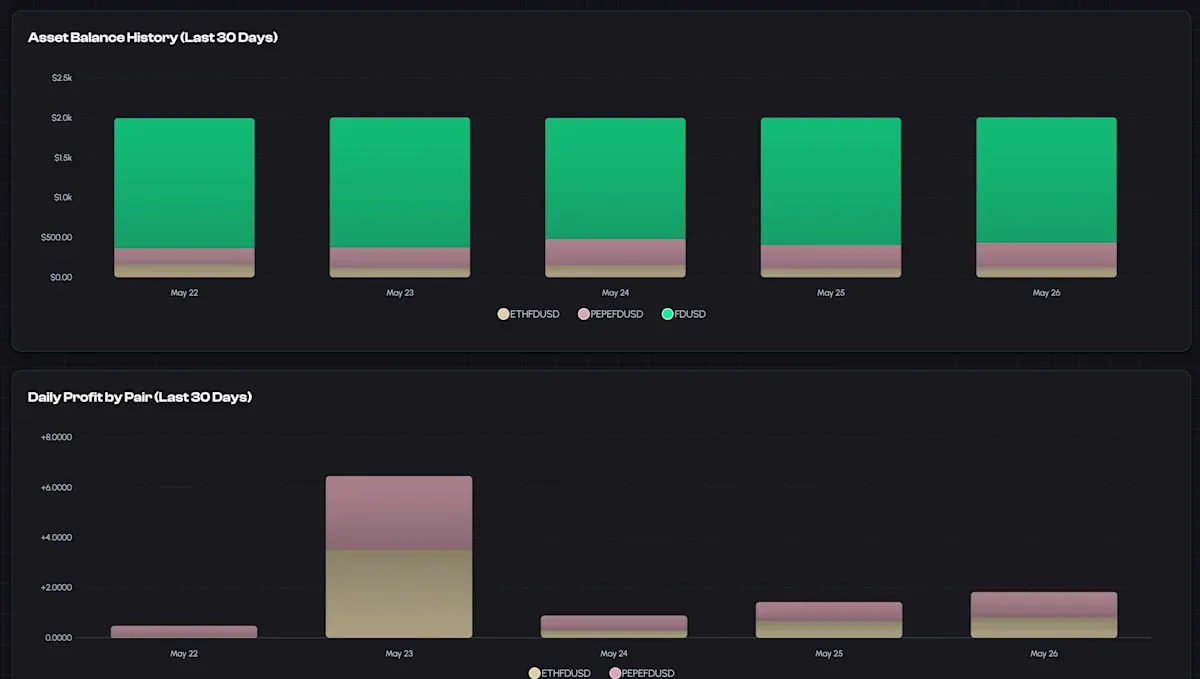
Per-asset profit breakdown across the 4 days: The Daily Profit by Pair chart shows uneven distribution. May 23 was the breakout day with approximately $6.40 in profit, where ETH contributed roughly $3.50 and PEPE roughly $2.90. The other four days combined produced approximately $4.60. This pattern matters and I'll come back to it.
Current portfolio composition:
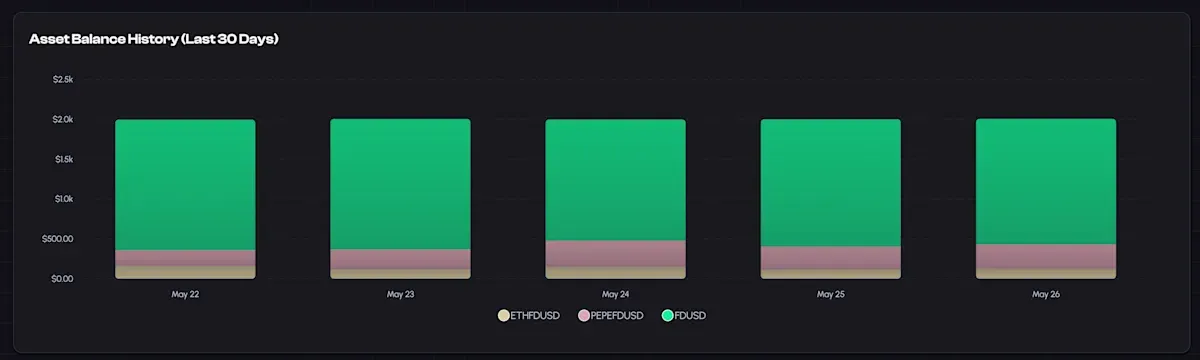
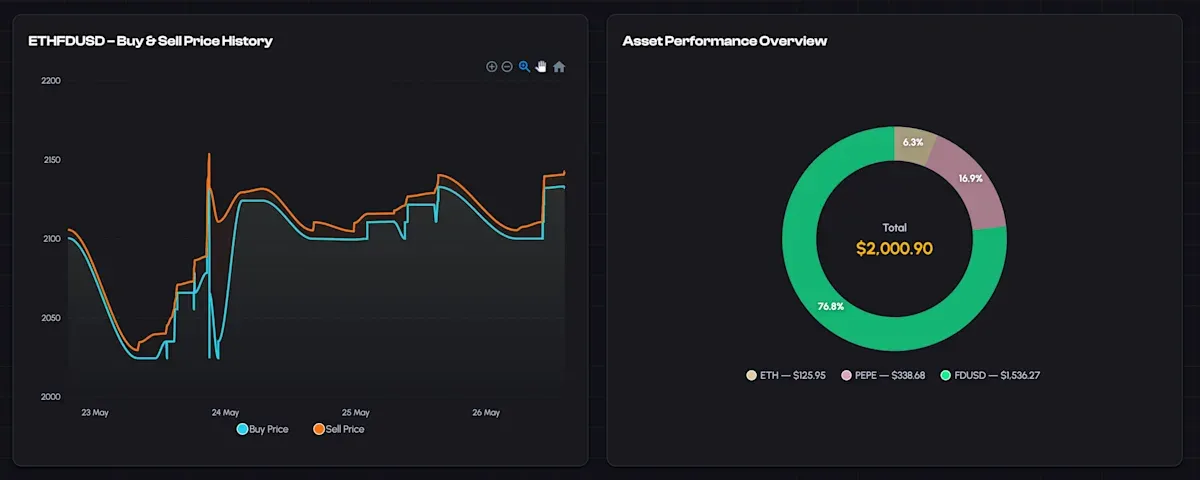
- FDUSD (stablecoin reserve): $1,568.27 representing 78.2%
- PEPE position: $309.39 representing 15.4%
- ETH position: $127.07 representing 6.3%
- Total account value: $2,004.73
The FDUSD zero-fee promo: a critical detail most articles miss
Here's something that significantly affects the economics of bot trading on Binance right now, and almost no comparison article mentions it.
Binance is currently running a zero-fee promotion for FDUSD trading pairs. This means trading ETHFDUSD or PEPEFDUSD costs nothing in Binance trading fees. Regular Binance Spot trading typically costs 0.1% maker/taker, reducible to 0.075% with BNB fee discounts.
For high-frequency bot strategies, this changes the entire economic equation. With 370 completed sells in 4 days, normal Binance fees would have consumed roughly $4 to $6 of the gross profit. Under the FDUSD promo, that cost is zero.
The implication for bot strategy choice is direct. If you're running tick-based strategies that execute many small trades per day, FDUSD pairs currently offer materially better net economics than USDT pairs on the same assets. This isn't a permanent state. Binance promotions change. But while the promo runs, it represents a meaningful structural advantage that many retail traders don't optimize for.
This is also part of why the 4-day result looks the way it does. The same strategy running on USDT pairs with normal fees would have produced approximately $5 to $7 in net profit instead of $11.02 gross. The promo is not the strategy. But it's a real input that shows up in the bottom line.
For traders considering bot deployment on Binance: check current fee promotions before choosing your trading pairs. The math changes based on which quote currency you choose, and the difference can be substantial on high-frequency strategies.
What this looks like extrapolated (carefully)
Here's where most trading bot content gets dangerous. Short-term results get extrapolated into yearly projections that imply guaranteed returns. I want to do this carefully.
Raw math on this specific 4-day window:
$11.02 gross profit divided by 4 days equals approximately $2.76 average daily profit.
$2.76 times 365 days equals approximately $1,007 projected annual gain (linear extrapolation, no compounding).
$1,007 divided by $2,000 starting capital equals approximately 50% annualized.
Per month, that works out to roughly 4% if conditions stayed constant.
What this number actually represents: A naive linear extrapolation from a 4-day window that happens to include a high-volatility day (May 23 contributed more than half the total profit) and benefits from the active FDUSD zero-fee promo on Binance. Three variables drove this result: market regime during the window, exchange fee structure during the window, and trading pair choice optimized for both. Change any of these and the same bot produces very different numbers.
The 50% annualized figure is not a forecast, a target, or a baseline expectation. It is arithmetic applied to a favorable 4-day sample. Treating it as anything more would be exactly the kind of misleading extrapolation this article is designed to avoid.
How to think about realistic ranges
Looking at the broader picture, 4% per month sits at the upper end of what disciplined retail bot trading can produce under favorable conditions. In my experience across multiple years and market conditions, sustainable averages typically land lower than that, in the 1-3% monthly range when averaged across favorable and unfavorable periods. The current window appears to be on the favorable side.
What actually drives where your result lands in any given period:
- Market regime. Ranging volatility with directional swings (like the past 4 days) produces strong bot returns. Choppy sideways without amplitude produces whipsaws. Strong directional trends without retracements produce underperformance relative to hodl.
- Cost structure during the period. Exchange fee promos, BNB discount eligibility, withdrawal frequency, and tax software costs all materially affect net returns. The same gross result produces very different net depending on these.
- Trading pair choice. Pairs with high volatility, tight spreads, and zero-fee promos produce different results than pairs without these properties. This is not a strategy variable, it's a structural variable.
- Strategy-to-regime fit. A grid strategy in a ranging market and a trend strategy in a trending market both work. Mismatched deployments produce poor results regardless of how well the strategy is configured in isolation.
General ranges I have observed across multiple years:
- 1-3% per month under disciplined operation across mixed market conditions, with appropriate pair selection and reasonable cost structure
- 4-6% per month during genuinely favorable conditions with optimal pair selection and active fee promotions (closer to what this 4-day window is showing)
- Higher monthly returns sometimes appear during peak bull market phases or specific high-volatility events, but these are rare and not sustainable over annual periods
- Negative returns during hostile regimes that don't match the strategy type
The 4-day result is real, but treating it as a baseline expectation for the year would be misleading. Bad weeks happen. Promos end. Market regimes shift. Sustainable averages are lower than favorable-window snapshots, and that gap is the entire reason this article exists in the first place.
The profit clumpiness that matters more than the average
One of the most important details visible in the dashboard isn't the total profit. It's how that profit was distributed across the 4 days.
The Daily Profit by Pair chart reveals an uneven pattern:
- May 22: small profit, roughly $0.50 (startup day, positions being established)
- May 23: large profit, approximately $6.40 (the breakout day, ETH plus PEPE both contributed strongly)
- May 24: modest profit, approximately $0.80
- May 25: modest profit, approximately $1.40
- May 26: modest profit, approximately $1.70
More than half of the total 4-day profit came from a single day.
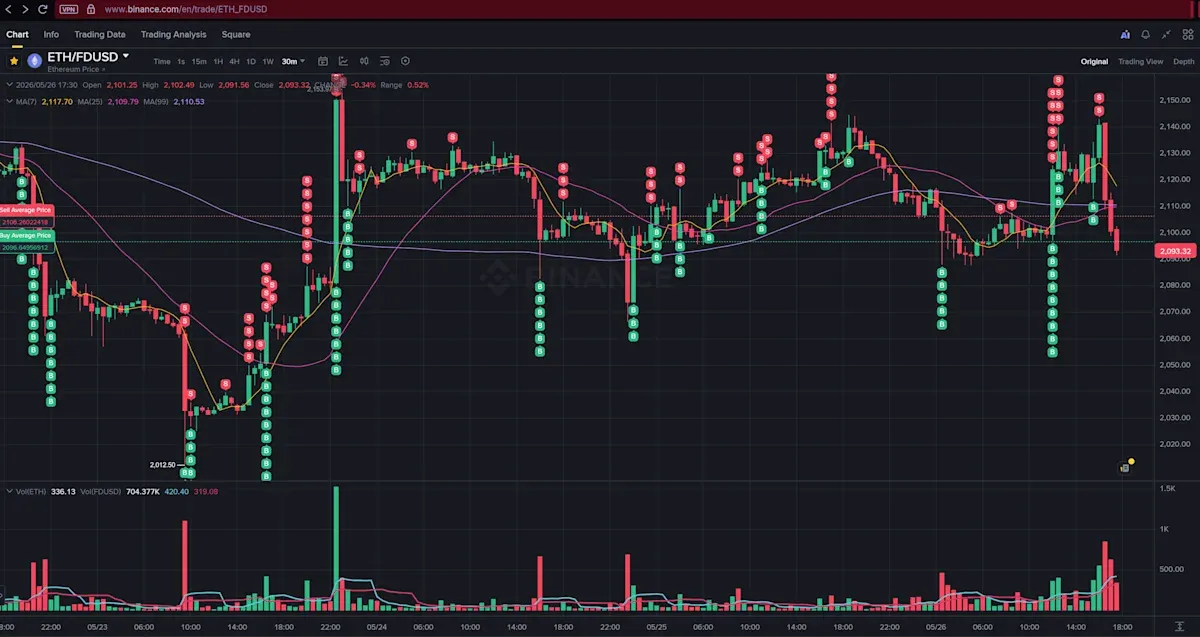
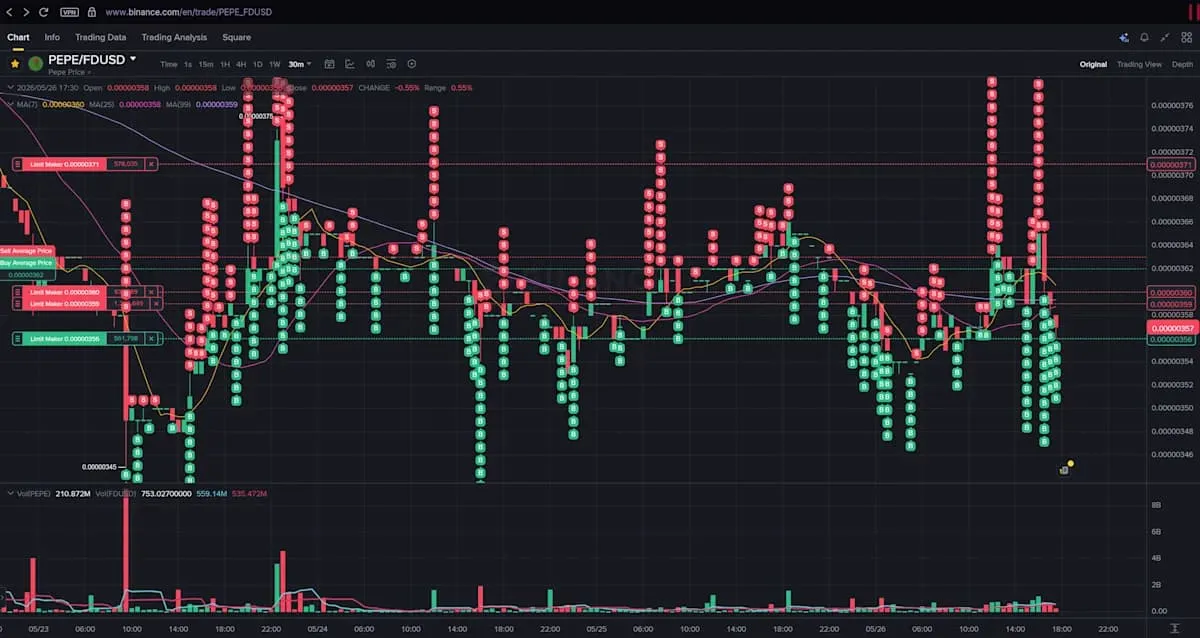
This is structurally important for understanding bot trading. Profit is not linear. The bot doesn't make $2.76 every day. It makes near-zero some days and concentrated gains on volatile days. May 23 happened to coincide with a significant ETH price swing visible in the buy/sell price history chart, which shows ETH spiking up to roughly $2,150 before retracing.
The lesson here applies to all bot trading: volatility creates opportunity. Quiet markets produce small steady gains. Volatile sessions produce most of the realized profit. A trader who deploys for 30 days and gets 3-5 high-volatility days will land in or above the realistic range. A trader who deploys during 30 days of sideways calm will struggle to hit the lower bound.
This is also why short-window backtesting is so misleading. A 4-day window that happens to include a volatility spike looks dramatically better than a 4-day window that doesn't. The same strategy across the same total time can show 10x different results based purely on which days got captured.
Why this matters: hodl vs bot comparison
Here's the comparison that makes the bot case stronger than headline returns suggest.
If you had bought $2,000 of Ethereum at the same start price 4 days ago and held it, you would have the same quantity of ETH now. The price moved roughly sideways across the window, dropping about 5% and then recovering close to the start. Your USD value would be roughly $2,000, perhaps slightly less depending on entry timing.
With the bot running, the account shows $2,004.73 actual liquid value (accounting for open positions still pending). Plus the bot is positioned to continue extracting profit from continued volatility, with $1,568 in stablecoin reserves ready to deploy on the next opportunity.
Both approaches involved Ethereum exposure. One captured the volatility, the other waited for directional movement that didn't come.
The structural point: Hodl works when prices trend up over your holding period. It fails when prices trade sideways for weeks or months. Bot trading converts sideways volatility into realized profit, which is exactly what a 5% down then 5% up move provides.
This isn't an argument against hodling. Bitcoin and Ethereum at long-term horizons have produced meaningful returns through buy-and-hold. But during ranging market regimes, hodl produces nothing while bot trading continues to extract value from the price action.
What the bot actually did across these 4 days
The dashboard tells the operational story.
Trade pattern on PEPE: Many small trades, each capturing 1-2 cents of price movement, multiplied across high frequency. The aggressive configuration on a high-volatility token produces frequent entries and exits during active periods. Currently $309.39 deployed in PEPE position.
Trade pattern on Ethereum: Fewer trades, larger per-trade values, driven by the bigger price swings that ETH produces. The slower pace matches the asset's lower volatility, and the bot adapts automatically based on configured signal thresholds. Currently $127.07 deployed in ETH position.
Cumulative pattern visible on the dashboard: The Cumulative Profit chart shows the texture clearly. Slow start (day 1 as positions were being established), then a sharp acceleration on May 23 from roughly $1.89 to $7.57 in a single steep climb, followed by steady gradual accumulation through the remaining days to reach the current $11.02.
This is the actual texture of bot trading. Not a smooth line up, not constant gains, but a pattern of accumulating small profits punctuated by step-changes when the market provides genuine volatility. The compound effect emerges over weeks and months, not over individual days.
What the portfolio composition shows
Current portfolio allocation after 4 days:
FDUSD (stablecoin): $1,568.27 representing 78.2% of total deployed capital
PEPE position: $309.39 representing 15.4%
ETH position: $127.07 representing 6.3%
Total account value: $2,004.73
The 78.2% stablecoin position is intentional. The bot keeps significant capital reserves for new entries when conditions shift. Running a bot at 100% deployment removes the ability to respond to favorable entry opportunities and exposes the account to catastrophic single-direction moves.
The PEPE position being more than double the ETH position is also informative. PEPE has higher volatility per dollar invested, which means the bot ends up holding more PEPE on average because there are more in-progress positions waiting for take-profit triggers. ETH positions close faster because of the smaller percentage movements between entry and exit signals.
This is one of the conservative defaults that matters in real deployment. Aggressive configurations that deploy 90%+ of capital produce better marketing numbers during favorable periods and destroy capital during regime shifts. The 78% cash buffer is the price of long-term survivability.
The economic reality including all costs
To make this honest, here's what the actual net economics look like.
Gross gain over 4 days: $11.02
Binance trading fees: $0.00 (FDUSD zero-fee promo currently active)
unCoded performance fee (accrued at 20% rate, not yet settled): approximately $2.20
Server costs (VPS hosting for self-hosted deployment, roughly $12/month): approximately $1.60 across 4 days
Estimated net to user across 4 days: approximately $7.20
That's the honest math. The unCoded fee accrues continuously but settles when withdrawn rather than per-trade. The Binance fee component is zero only because of the current FDUSD promo. The server cost is a fixed monthly expense.
Over longer periods this ratio improves significantly. Server costs are fixed and become a smaller percentage of returns as profits accumulate. The unCoded performance fee scales with profit (zero in losing months). If the FDUSD promo ended, Binance fees would re-enter the equation but bot strategies could be reconfigured for other pair structures.
The 4-day window shows favorable economics partly because the promo eliminates one cost category entirely. A trader running the same strategy on USDT pairs would see a different ratio. This is worth understanding when comparing results across different exchange setups.
What this experiment is actually testing
The 4-day window is too short to prove anything definitive about strategy performance. What it's testing is operational reality:
Does the bot execute correctly? Yes. 370 closed trades with the configured parameters, accurate fee tracking (or lack thereof, given the promo), clean tax-relevant reporting.
Does the math work for small portfolios? Yes at this scale and with this promo active. A $2,000 account producing $11.02 in 4 days covers server costs and platform fees with significant room left over. That was not true for my Cryptohopper Hero tier deployment 5 years ago on similar capital.
Does the architecture handle different asset types? Yes. ETH and PEPE require very different bot behavior, and the same framework adapted to both with mode and configuration differences.
Is this representative of long-term performance? No. 4 days is statistical noise. The experiment will continue across weeks and months, including periods that don't look like this one. The May 23 spike day contributed disproportionately to total profit, and not every week will contain a day like that.
What the experiment is not testing: Whether bot trading is universally profitable. Whether all configurations work in all conditions. Whether the recent favorable conditions plus the FDUSD promo will persist.
What I'll be watching across longer time horizons
The interesting question isn't what happens in week 1. It's what happens across multiple market regimes.
Volatile ranging market (current): Bot extracts profit from oscillation. Performance should be strong relative to hodl, which is what we're seeing now.
Strong directional uptrend: Bot may underperform hodl because realized profits get taken at lower levels than the eventual peak. This is the failure mode of profit-taking strategies during bull moves.
Strong directional downtrend: Bot may accumulate losses if positions are entered and the market continues lower. This is where conservative defaults like canBuyDown=false matter, preventing endless accumulation into a falling price.
Choppy sideways without clear range: Bot may produce whipsaw losses as false signals trigger entries that immediately reverse. This is the most challenging regime for most strategy types.
End of FDUSD promo: Net economics shift if Binance restores normal fees on FDUSD pairs. The same gross profit produces less net to the trader. Strategy adjustments may be needed depending on what other promos exist at that time.
The 4-day result represents one of these conditions plus favorable fee structure. The annual extrapolation only holds if both conditions stay similar, which they almost certainly won't on a 12-month horizon. Honest expectations include weeks where the bot makes nothing, weeks where it gives back gains from prior weeks, and changes in exchange fee structures that affect net returns.
What this means for traders evaluating bot deployment
Several practical takeaways from this 4-day window:
Start with realistic capital, not optimistic projections. $2,000 is a reasonable validation amount for self-hosted deployment. It's enough to produce meaningful trade volume and fee structure data while small enough that bad outcomes during validation don't damage your portfolio.
Optimize your trading pairs for current fee structure. The FDUSD zero-fee promo on Binance is real and changes net economics materially for high-frequency strategies. Check what's active before choosing pairs. This applies to any exchange you deploy on, not just Binance.
Track gross vs net carefully. The headline numbers and the after-fee numbers tell different stories. Platform fees, exchange fees, and server costs all matter, especially on smaller accounts where fixed costs become higher percentages of returns.
Don't extrapolate short windows. This 4-day result extrapolated to 50% annualized is mathematically correct but predictively meaningless. Use multi-month observation periods before drawing conclusions about expected returns. And remember that any favorable promo conditions inflating short-window results may not persist.
Watch the profit distribution, not just the total. May 23 contributed more than half of the 4-day total. That's the actual texture of bot trading: clumpy gains driven by volatile sessions, not steady linear accumulation.
Verify the tax accounting works. unCoded's CSV export with 2026 tax-relevant data ready for tax software is part of why I built it this way. Bot trading produces hundreds or thousands of taxable events per year that cannot be reconstructed manually. If your platform doesn't produce clean tax data, you'll regret it during the next filing season.
Watch the portfolio composition, not just the PnL. A bot that produces gains while running 95% deployed is more fragile than one producing similar gains while maintaining cash reserves. The 78% cash reserve in this experiment is part of what makes the architecture robust to unexpected moves.
The honest summary
4 days of live trading on a $2,000 Binance account with unCoded produced $11.02 in gross profit and approximately $7.20 estimated net after performance fees and server costs. Binance trading fees were zero thanks to the active FDUSD zero-fee promotion.
Extrapolated linearly, that's roughly 50% annualized or 4% monthly gross. That number is a snapshot, not a forecast. It reflects a specific 4-day window with favorable market conditions and an active fee promo. Change the market regime, change the exchange fee structure, or change the pair selection and the same bot produces very different numbers.
More than half of the 4-day profit came from a single high-volatility day (May 23). That's not unusual. It's the actual texture of bot trading. Bots extract value from market movement, and markets don't move evenly across time.
The experiment continues. Future updates will document what happens during less favorable market regimes, when ranging gives way to trending, when the bot underperforms hodl, and when conditions like the FDUSD promo change. Real bot trading includes periods that don't look like this one.
The point of running this publicly isn't to prove that bot trading always works. It's to show what real bot trading actually looks like on a real account, with real costs, real fees, real drawdowns, and real recovery patterns. The honest version is more useful than the marketing version, even when the honest version includes the bad weeks.
For users interested in evaluating unCoded's full backtest distribution across multiple years and tokens (including the years where strategies failed on the majority of tokens), the public data is at uncoded.ch/backtesting. Documentation at uncoded.ch/docs.
Video documentation of this 4-day window with live dashboard footage: youtu.be/A2c1kLAjLac.
Next update when there's more data worth analyzing. Probably around the 30-day mark, which is where statistical significance starts to emerge.
Felix Götz is Co-Founder and CTO of ArrowTrade AG, the company behind unCoded. A self-hosted, non-custodial crypto trading bot with profit-sharing pricing. ArrowTrade AG operates from Switzerland under the Swiss DLT regulatory framework. The "unCoded" trademark is registered through EUIPO.
Recommended Reading

3Commas vs unCoded: An Honest Crypto Trading Bot Comparison for 2026
By Felix Götz – Co-Founder and CTO of ArrowTrade AG, building unCoded since 2016 in crypto trading. ...

Why Choose unCoded Trading Bot
We only make money when you do. Self-hosted, non-custodial crypto bot trading with profit-sharing pr...

When Germany's Crypto Tax Holiday Ends: What the Proposed Repeal of the One-Year Holding Period Means for Trading Bots
By Felix Götz – Co-Founder and CTO of ArrowTrade AG, building unCoded since 2016 in crypto trading. ...
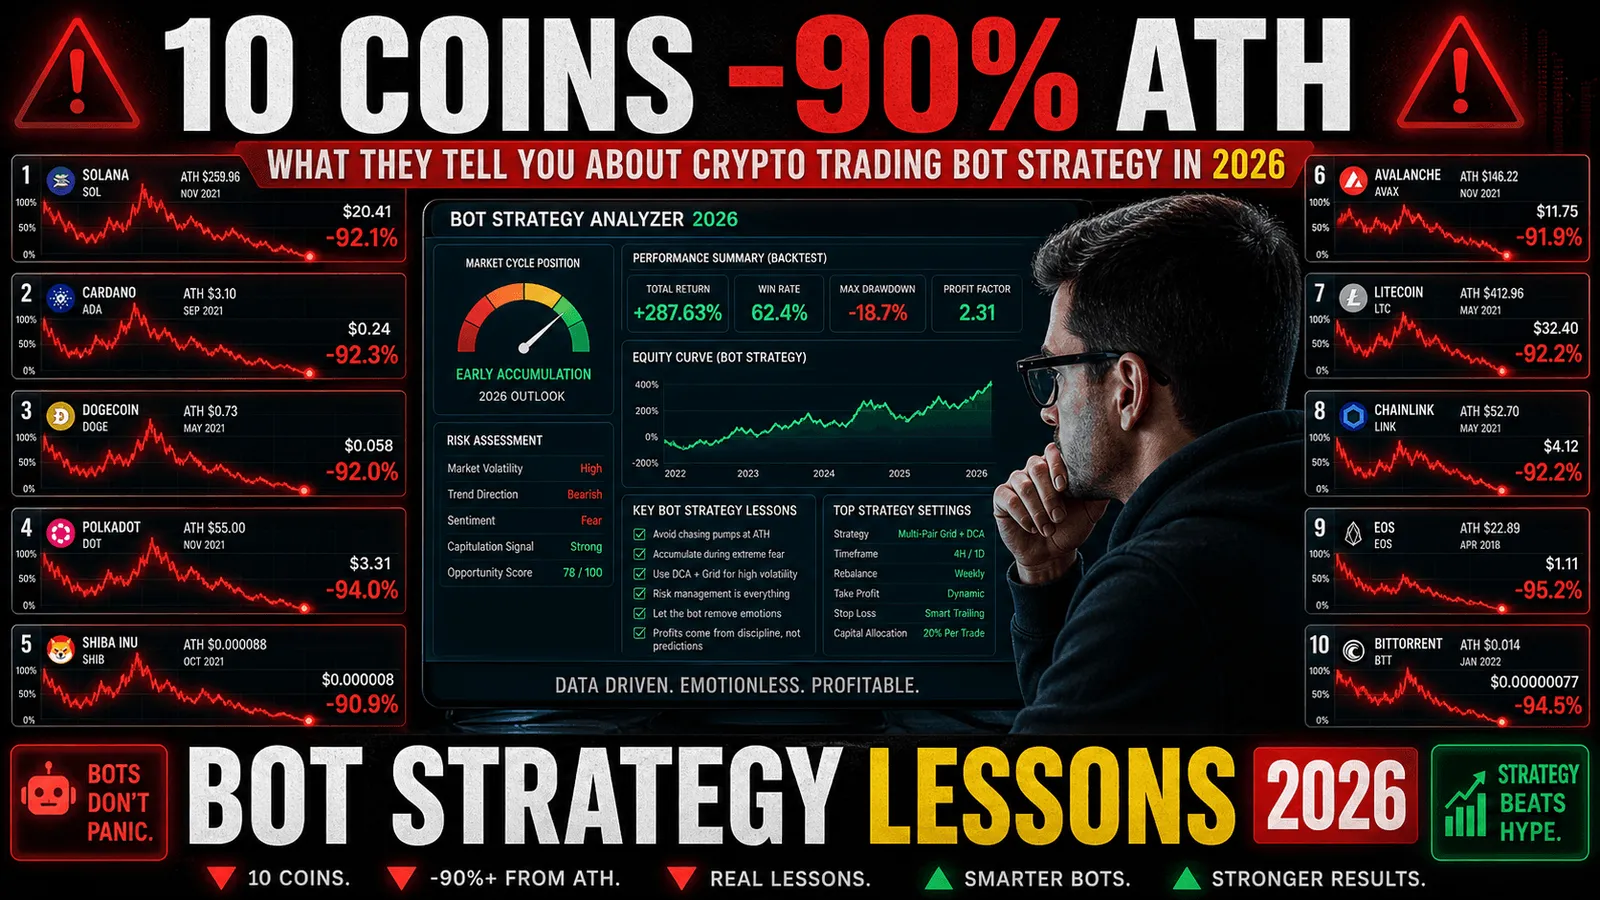
What 10 Coins Down 90%+ from Their All-Time Highs Tell You About Crypto Trading Bot Strategy in 2026
By Felix Götz – Co-Founder and CTO of ArrowTrade AG, building unCoded since 2016 in crypto trading. ...
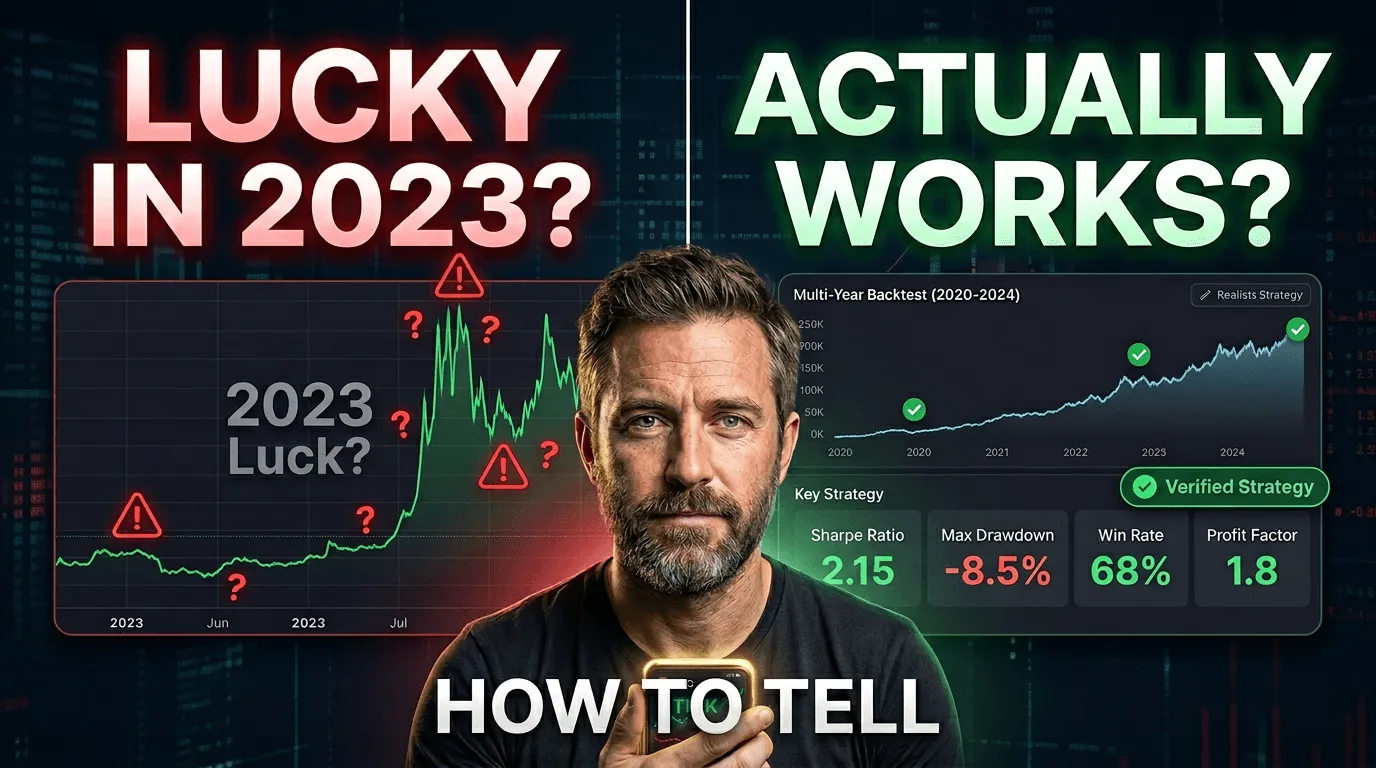
How to Tell If a Crypto Trading Bot Strategy Actually Works (Or Just Got Lucky in 2023)
By Felix Götz – Co-Founder and CTO of ArrowTrade AG, building unCoded since 2016 in crypto trading. ...

My Honest Experience with Crypto Trading Bots on a Normal Portfolio – Here’s What They Actually Cost Me
By Felix Götz – founder of unCoded, trading crypto since 2016. Before we start: What follows isn't f...

Are Crypto Trading Bots Profitable in 2026? An Honest Answer After Five Years of Running Them
By Felix – founder of unCoded, trading crypto since 2016. Before we start: What follows isn't financ...

How to Build a Crypto Trading Bot That Actually Works in Production
By Felix – founder of unCoded, trading crypto since 2016. I've had this conversation probably thirty...

unCoded Is an IQ Test. That's Not a Marketing Line.
By Felix – founder of unCoded, trading crypto since 2016. Most trading bot platforms optimize for th...

Why Your Crypto Trading Bot Backtest Fails: Test Against 100 Charts, Not One
By Felix – founder of unCoded, trading crypto since 2016. Every backtest you've ever run lies to you...